Proportional Relationships: Percent is a fundamental topic in mathematics that helps students understand how quantities are related to each other in real-life situations. Percent is used to describe parts of a whole out of 100, making it a powerful tool for comparing values, analyzing data, and interpreting changes such as increases, decreases, discounts, and statistics.
In this lesson on proportional relationships and percent, students will learn how to find a percent of a quantity, express percent as a fraction and as a decimal, and solve real-world problems using proportional reasoning. A strong focus is placed on proportional tables, a method commonly used in American math textbooks to organize information and justify calculations clearly.
This step-by-step lesson includes worked examples, guided practice, common mistakes, and additional exercises, along with a downloadable PDF to support learning and review.
Table of Contents
Learning Objectives
By the end of this lesson on proportional relationships and percent, students will be able to:
- understand percent as a rate per 100
- represent percent as a fraction and as a decimal
- identify proportional relationships involving percent
- use proportional tables to find a percent of a quantity
- solve real-world problems involving percent increase and percent decrease
- interpret tables and data expressed in percent
What Is Percent?
Percent means “per hundred.”
The word percent comes from the Latin phrase per centum, which means “out of 100.”
A percent is used to describe a part of a whole by comparing it to 100 equal parts. Because of this, percent is closely connected to proportional relationships.
For example:
- 25 percent means 25 out of 100
- 50 percent represents one half of a whole
- 100 percent represents the entire quantity
Percent is commonly used to describe real-world situations such as discounts, test scores, population data, and measurements. When working with percent, the total or whole is always considered to be 100.
Understanding percent as a rate per 100 helps students reason proportionally and compare quantities more easily, even when the total amounts are different.
Percent as a Fraction and a Decimal
A percent can always be written as a fraction or as a decimal. These representations are equivalent and describe the same proportional relationship.
Writing Percent as a Fraction
Since percent means “out of 100,” any percent can be written as a fraction with a denominator of 100.
Examples:
- 25 percent = 25/100
- 60 percent = 60/100
- 75 percent = 75/100 = 3/4
Writing percent as a fraction helps students connect percent to proportional reasoning and fraction concepts.
Writing Percent as a Decimal
To write a percent as a decimal, divide by 100.
Examples:
- 25 percent = 0.25
- 60 percent = 0.60
- 75 percent = 0.75
Decimals are often used when calculating a percent of a quantity because they make multiplication easier.
Writing a Fraction as a Percent
To convert a fraction to a percent, multiply by 100.
Examples:
- 36/45 = 0.8 = 80 percent
- 24/40 = 0.6 = 60 percent
Understanding how to move between percent, fractions, and decimals is essential for solving problems involving proportional relationships and percent.
Using Proportional Tables to Find Percent
A proportional table is a useful tool for organizing information and showing proportional relationships involving percent. Because percent is based on 100, proportional tables help students clearly see how quantities scale up or down.
Setting Up a Proportional Table
In percent problems, the whole is always associated with 100 percent.
Example
A school has 800 students.
60 percent of the students are girls.
How many girls are there?
| Percent | Number of Students |
|---|---|
| 100% | 800 |
| 60% | ? |
Finding the Unit Rate
To move from 100 percent to 1 percent, divide by 100.
800 ÷ 100 = 8
This means 1 percent corresponds to 8 students.
Finding the Desired Percent
Now multiply by 60.
8 × 60 = 480
There are 480 students who are girls.
Why Proportional Tables Are Helpful
Proportional tables:
- make the relationship between percent and quantity clear
- support mathematical reasoning and explanation
- help avoid common calculation mistakes
Using proportional tables strengthens understanding of proportional relationships and percent, especially when solving real-world problems.
Finding a Percent of a Quantity
To find a percent of a quantity, students use proportional reasoning. This means finding a part of a whole based on a given percent.
Because percent represents a value out of 100, it can be written as a fraction or a decimal and then multiplied by the total quantity.
Method 1: Using a Decimal
First, convert the percent to a decimal by dividing by 100.
Then multiply by the given quantity.
Example
Find 30 percent of 420.
30 percent = 0.30
0.30 × 420 = 126
So, 30 percent of 420 is 126.
Method 2: Using a Proportional Table
A proportional table can also be used to organize the information.
| Percent | Quantity |
|---|---|
| 100% | 420 |
| 30% | ? |
Divide by 100 to find 1 percent.
420 ÷ 100 = 4.2
Multiply by 30.
4.2 × 30 = 126
Both methods lead to the same result.
Choosing a Method
Using decimals is often faster, while proportional tables help explain the reasoning clearly. Both methods rely on understanding proportional relationships and percent.
Percent Increase and Percent Decrease
Percent is often used to describe how a quantity changes. These changes can be an increase or a decrease, and they are always based on the original amount.
Percent Increase
A percent increase occurs when a quantity becomes larger than its original value.
To find a percent increase:
- Convert the percent to a decimal.
- Multiply the original amount by the decimal to find the increase.
- Add the increase to the original amount.
Example
An item costs 250 dollars.
The price increases by 10 percent.
10 percent = 0.10
Increase
250 × 0.10 = 25
New price
250 + 25 = 275
The new price is 275 dollars.
Percent Decrease
A percent decrease occurs when a quantity becomes smaller than its original value.
To find a percent decrease:
- Convert the percent to a decimal.
- Multiply the original amount by the decimal to find the decrease.
- Subtract the decrease from the original amount.
Example
An item costs 250 dollars.
The price decreases by 20 percent.
20 percent = 0.20
Decrease
250 × 0.20 = 50
New price
250 − 50 = 200
The new price is 200 dollars.
Key Idea
In percent increase and decrease problems, the percent is always applied to the original amount, not the new amount. This reinforces the idea of proportional relationships and percent.
Reading Tables and Data in Percent
Percent is often used to organize and interpret data in tables and charts. Reading percent data correctly helps students understand how a whole is divided into parts and compare different categories.
Understanding Percent in a Table
In any percent table, the total represents 100 percent.
Each value shows the part of the whole that belongs to a specific category.
Example
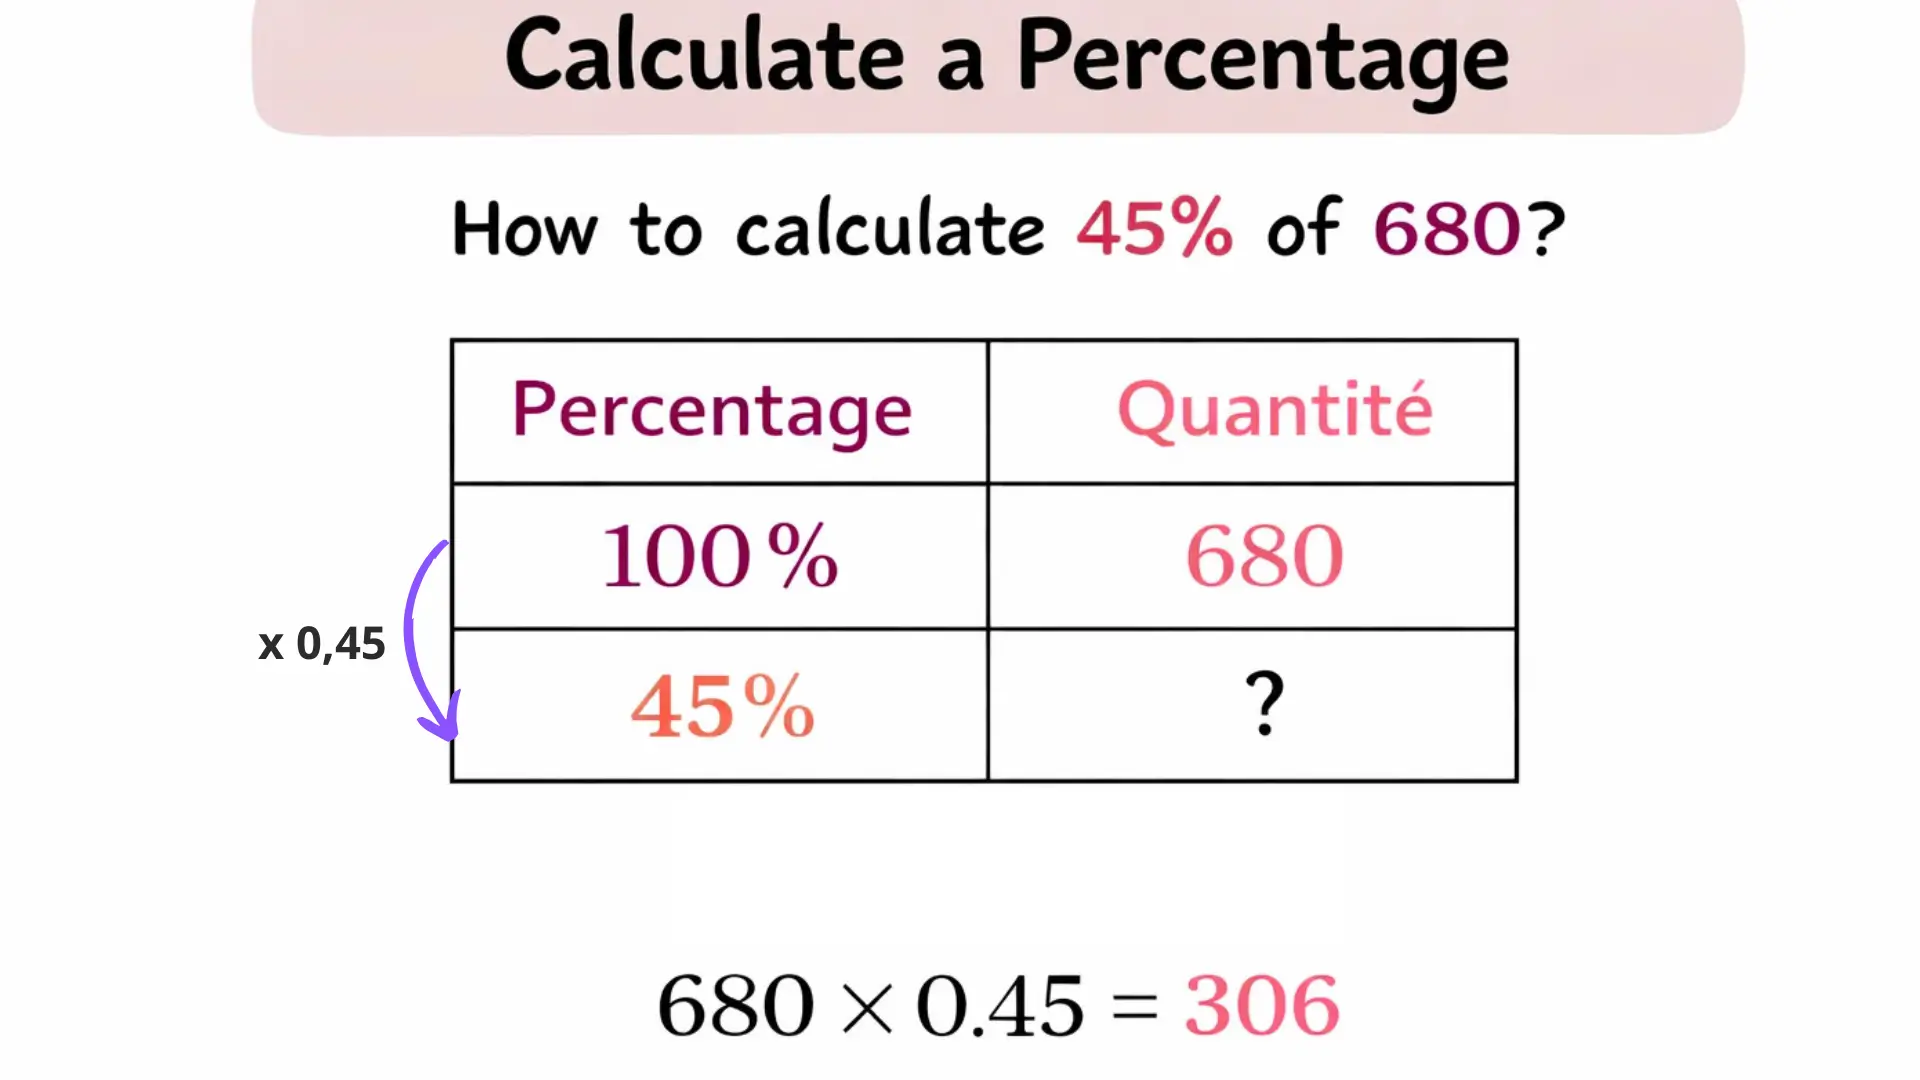
A table shows the distribution of blood types in a population.
If Type O represents 45 percent, this means that out of every 100 people, 45 have blood type O.
Finding a Quantity from a Percent
To find the number of items in a category, multiply the total by the percent written as a decimal.
Example
A population has 2,000 people.
45 percent are in Group O.
45 percent = 0.45
0.45 × 2,000 = 900
There are 900 people in Group O.
Comparing Data Using Percent
Percent makes it easier to compare categories, even when totals are large. The category with the greatest percent represents the largest part of the whole.
Reading tables and data in percent strengthens understanding of proportional relationships and percent and prepares students to analyze real-world information.
Practice Problems
The following problems allow students to practice working with proportional relationships and percent. Show all work and explain your reasoning when possible.
Problem 1
A store has 500 items in stock.
40 percent of the items are on sale.
How many items are on sale?
Problem 2
A class has 800 students.
60 percent of the students are girls.
How many girls are in the class?
Problem 3
A jacket costs 120 dollars.
The price decreases by 25 percent.
What is the amount of the discount?
What is the new price of the jacket?
Problem 4
A student scored 45 points on a test worth 60 points.
What percent of the test did the student score?
Problem 5
In a survey, 18 out of 30 people prefer online shopping.
What percent of the people prefer online shopping?
These problems help reinforce the connection between percent, fractions, decimals, and proportional reasoning.
Worked Solutions
Solution to Problem 1
Total items: 500
Percent on sale: 40 percent
40 percent = 0.40
0.40 × 500 = 200
There are 200 items on sale.
Solution to Problem 2
Total students: 800
Percent of girls: 60 percent
60 percent = 0.60
0.60 × 800 = 480
There are 480 girls in the class.
Solution to Problem 3
Original price: 120 dollars
Percent decrease: 25 percent
25 percent = 0.25
Discount
120 × 0.25 = 30
New price
120 − 30 = 90
The discount is 30 dollars, and the new price is 90 dollars.
Solution to Problem 4
Points earned: 45
Total points: 60
45 ÷ 60 = 0.75
0.75 = 75 percent
The student scored 75 percent on the test.
Solution to Problem 5
People who prefer online shopping: 18
Total people: 30
18 ÷ 30 = 0.60
0.60 = 60 percent
60 percent of the people prefer online shopping.
Common Mistakes
When working with proportional relationships and percent, students often make similar mistakes. Being aware of these errors helps improve accuracy and understanding.
One common mistake is forgetting that percent means out of 100. Students may forget to divide by 100 when converting a percent to a decimal.
Another frequent error is applying the percent to the wrong value. In percent increase or percent decrease problems, the percent must always be applied to the original amount, not the new amount.
Some students confuse the amount of change with the percent of change. For example, finding the dollar amount of a discount instead of the percent, or the percent instead of the amount.
Errors can also occur when setting up proportional tables. Placing 100 in the wrong position or using inconsistent operations across rows can lead to incorrect results.
To avoid these mistakes, students should clearly identify the whole, check that the percent is correctly converted, and ask whether the final answer makes sense in the context of the problem.
Teacher’s Note
When teaching proportional relationships and percent, it is important to emphasize reasoning over memorization. Students should understand that percent is a rate per 100 and that every percent problem is based on a proportional relationship.
Encourage students to use proportional tables, especially when introducing new concepts. Tables help students visualize how quantities scale and support clear mathematical explanations. Although using decimals is often faster, tables strengthen conceptual understanding.
It is also helpful to connect percent problems to real-life situations such as discounts, test scores, surveys, and population data. This makes the concept more meaningful and easier to remember.
Finally, ask students to estimate their answers before calculating. Estimation helps them check whether their results are reasonable and reinforces number sense.
Student Tips
When working with proportional relationships and percent, start by identifying the whole. Remember that the whole always represents 100 percent.
Before calculating, decide whether the problem is asking for a percent of a quantity, a percent increase, or a percent decrease. This helps you choose the correct method.
Convert the percent to a decimal carefully by dividing by 100. Check that the decimal makes sense before multiplying.
Use a proportional table if you are unsure. Tables help organize information and make the relationship between quantities clear.
After solving the problem, estimate your answer to see if it is reasonable. For example, 50 percent should be about half of the original amount.
Downloadable PDF
A downloadable PDF is available to support learning and practice with proportional relationships and percent.
What the PDF Includes
- a clear summary of key concepts
- step-by-step methods using decimals and proportional tables
- worked examples with explanations
- practice problems with complete solutions
- a section on common mistakes to avoid
This PDF can be used for classwork, homework, review, or independent practice. It is designed to help students reinforce their understanding and build confidence with percent problems.
Conclusion
Proportional relationships and percent are essential skills in mathematics and in everyday situations such as discounts, test scores, surveys, and data analysis. Understanding percent as a rate per 100 allows students to compare quantities and reason proportionally with confidence.
Using decimals and proportional tables helps make percent problems clear and organized. Visual summaries, worked examples, and practice materials, like those shared on Pinterest, can further support learning and help students review key ideas more effectively.
With consistent practice and clear strategies, students can master percent and strengthen their understanding of proportional relationships.
FAQ (Proportional Relationships: Percent)
What does percent mean in math
Percent means “per hundred.” A percent describes a part of a whole by comparing it to 100 equal parts. For example, 25 percent means 25 out of 100.
How do you find a percent of a number
To find a percent of a number, first convert the percent to a decimal by dividing by 100. Then multiply the decimal by the given number.
When should I use a proportional table
A proportional table is helpful when you want to clearly show your reasoning or when the numbers are complex. It helps organize information and makes proportional relationships easier to understand.
What is the difference between percent increase and percent decrease
Percent increase describes how much a quantity grows compared to its original value. Percent decrease describes how much a quantity is reduced. In both cases, the percent is always applied to the original amount.
Why do we divide by 100 when working with percent
We divide by 100 because percent means “out of 100.” Dividing by 100 converts the percent into a decimal that can be used for multiplication.
How can I check if my answer makes sense
Estimate your answer before or after calculating. For example, 50 percent should be about half of the original amount. Estimation helps confirm whether your result is reasonable.